
Amplicon sequencing: which microbes live in your samples, and how communities differ.
We read one marker gene from the bacteria, fungi or other organisms in each sample, then compare your groups. You get the community profile, the statistics and figures ready for the paper.
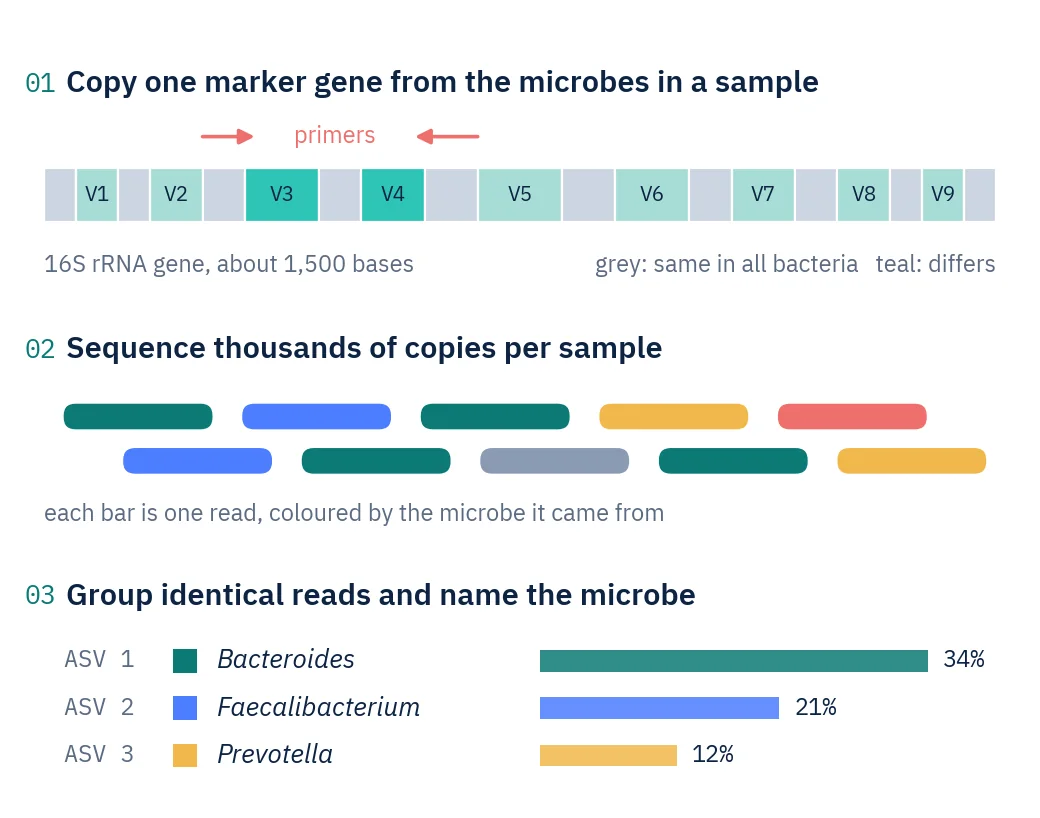
One marker gene works as a name tag for microbes.
Bacteria carry a gene called 16S rRNA. Most of it is the same in every species, but nine short stretches, the variable regions, differ from one group to the next. We copy one of these stretches from all the DNA in your sample and read the copies thousands of times.
Identical reads are grouped into exact sequence variants, and each variant is matched against a reference database to name the organism. Counting the reads per organism shows what each sample contains and in what proportions.
Fungi are profiled on a different marker, the ITS region, and other eukaryotes on the 18S gene. Animal DNA traces in water or sediment, known as environmental DNA, are read on the COI gene. One project can combine several markers.
Key terms
- Amplicon
- A short piece of DNA copied many times so that it can be sequenced.
- Variable region
- A stretch of the 16S gene that differs between bacterial groups. V3–V4 is our default.
- Sequence variant (ASV)
- An exact sequence found in the data. Identical reads are grouped into one variant, which stands for one type of microbe.
- Relative abundance
- The share of a sample’s reads that belongs to one organism.
- Alpha diversity
- How many different microbes a sample holds, and how evenly they are spread.
- Beta diversity
- How different the communities of two samples are, shown as a map where similar samples sit close together.
Bring the question. We design the experiment around it.
- Which bacteria go up or down after my treatment?
- Is diversity lower in patients than in healthy controls?
- Do my groups differ in overall community make-up?
- Which bacteria, fungi and animals live in this soil, water or sediment?
Where it is used
- Human and animal microbiomeGut, oral, skin and respiratory samples compared across diets, treatments and time points.
- Disease and treatment studiesCommunity changes between patients and controls, or before and after an intervention.
- Soil and plant healthMicrobes in soils and roots under healthy and stressed crops.
- Water, sediment and eDNASurveys of bacteria, fungi and animals from DNA left in the environment.
- Food and fermentationStarter cultures, fermented foods and sourdough communities.
- Samples with very little DNASwabs, cleanroom surfaces and other low-biomass material.
Four steps from sample to figures.
- Step 1
Plan the markers
We agree on the question, the markers (16S, ITS, 18S or COI) and how many samples each group needs.
- Step 2
Check the DNA
Samples are checked before library preparation, so problems show up while they are still cheap to fix.
- Step 3
Copy and sequence
The marker region is copied from every sample, tagged with a sample barcode and sequenced as 300-letter read pairs.
- Step 4
Analyse and report
Reads become named sequence variants, then diversity, group comparisons, figures and a Methods section.
What the analysis shows you.
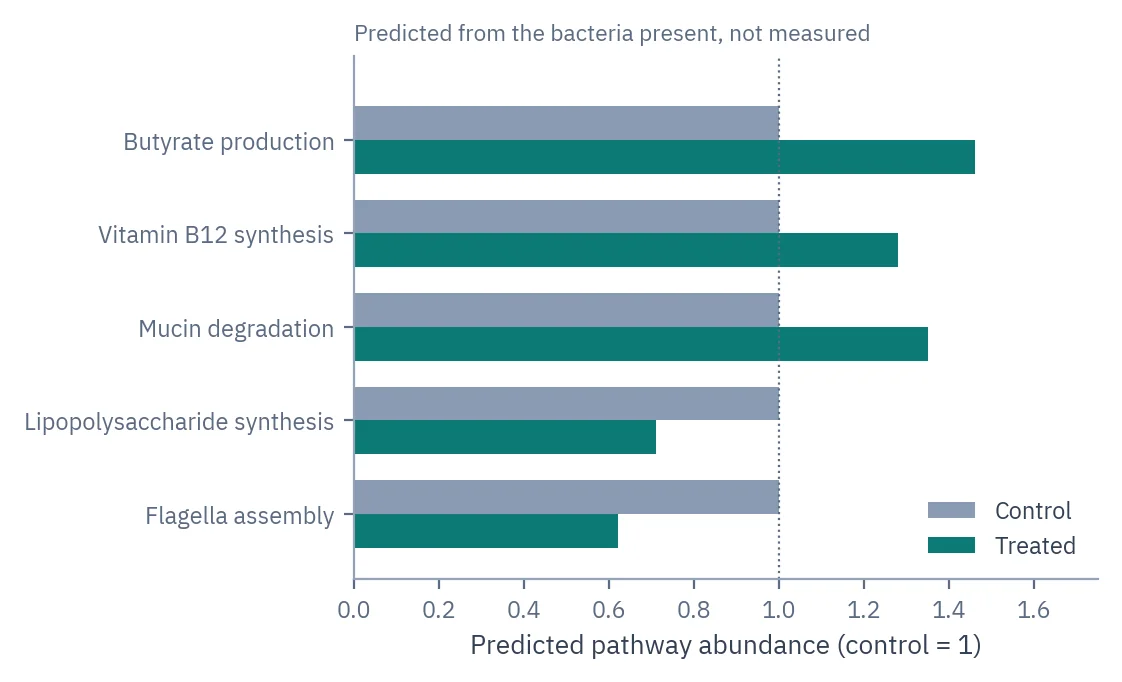
Predicted functions
Which metabolic pathways the community probably carries, estimated from the bacteria that are present.
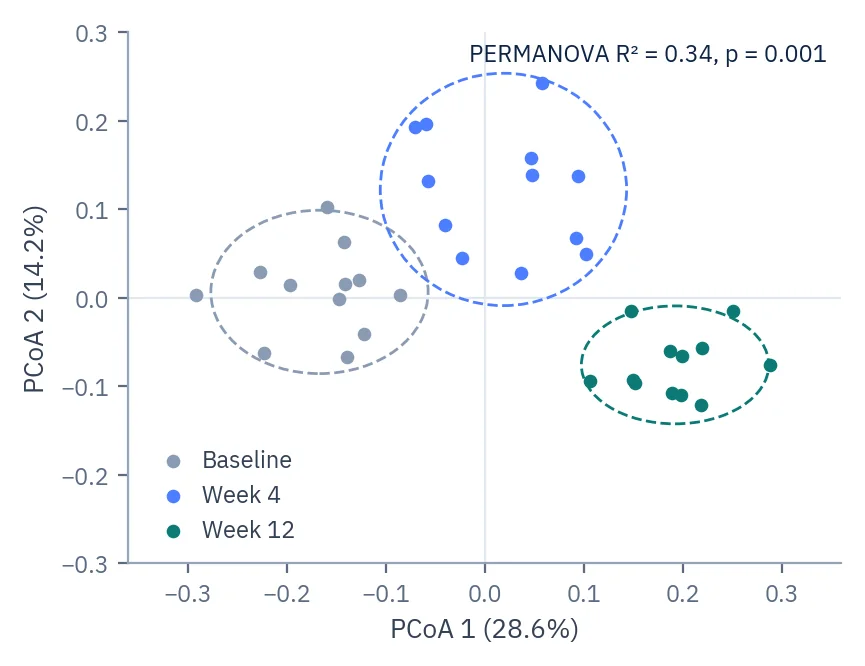
Community map
Each dot is one sample. Samples with similar communities sit close together, and the PERMANOVA test shows whether the groups really differ.
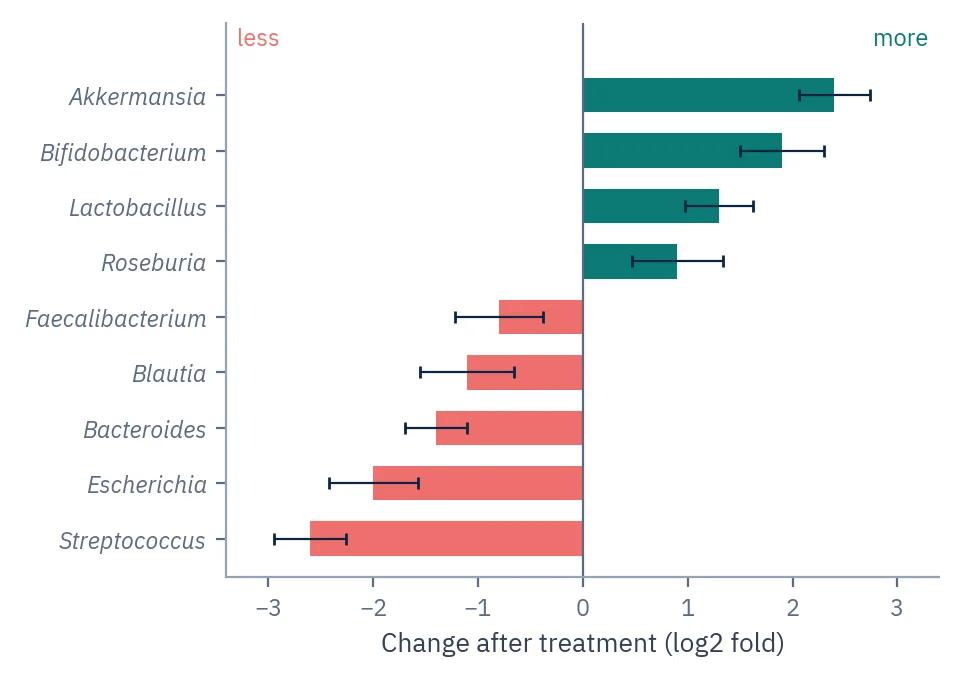
Which bacteria changed
Genera that became more common after treatment point right, those that declined point left, each with its uncertainty.
Included as standard every project
- Quality filtering and sequence variantsPrimers and low-quality bases are removed, and identical reads are grouped into exact sequence variants.
- A name for every variantEach variant is matched to a reference database, from phylum down to genus.
- Composition tables and bar chartsThe share of each organism in every sample, at every taxonomic level.
- Diversity within and between samplesRichness and evenness per sample, and a community map with a test for group differences.
- Differential abundanceWhich organisms changed between groups, corrected for testing many at once.
Added for your question custom
- Predicted functionsLikely gene functions and metabolic pathways, inferred from the bacteria present.
- Several markers in one projectBacteria, fungi, other eukaryotes and animals profiled side by side.
- Co-occurrence networksWhich microbes tend to rise and fall together.
- Machine-learning classificationWhether the community predicts a group or an outcome.
What goes in, and how we run it.
- Markers
- 16S V3–V4 for bacteria · ITS for fungi · 18S for other eukaryotes · COI for animal eDNA
- Sequencing
- Illumina, 2×300 bp read pairs
- Depth
- Set per project from the markers, the sample type and the question
- Samples
- Stool, soil, sediment, water, swabs, tissue, insects, low-biomass material
- Input
- Extracted DNA or raw samples · concentrations below 1 ng/µL accepted
- Main tools
- DADA2, QIIME 2, SILVA, ANCOM-BC, PICRUSt2
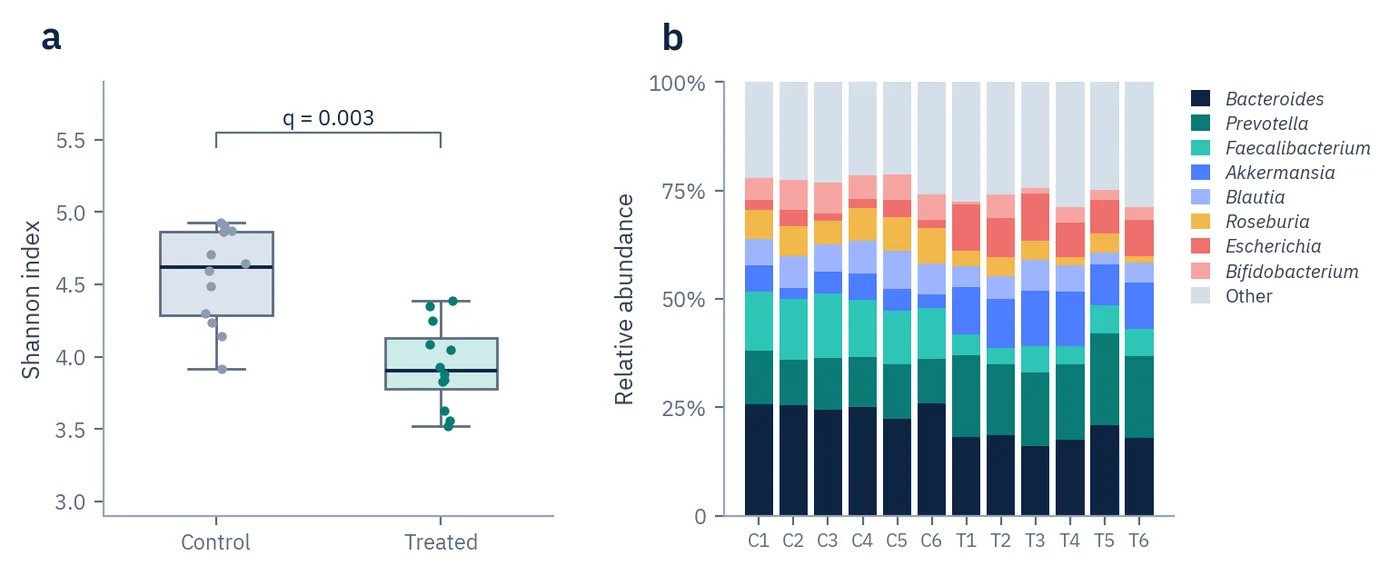
Figures, interpretation and Methods, ready for the manuscript.
- ReportInterpretation written against your hypothesis
- FiguresPublication-ready figures for the manuscript
- MethodsMaterials & Methods text for the paper
- Tables and dataAll results as tables, plus the processed data files
Amplicon or shotgun?
Bring the question to the call and the scientist recommends one, with the reasoning for your samples.
| Aspect | Amplicon sequencing | Shotgun metagenomics |
|---|---|---|
| What is read | One marker gene | All DNA in the sample |
| Naming depth | Usually genus | Species |
| Function | Predicted from who is there | Read from the genes themselves |
| Cost per sample | Lower, so more samples fit the budget | Higher, with deeper sequencing |
| Best when | Many samples, fungi and eukaryotes, very little DNA | Genes, genomes and cell counts matter |
Straight answers before you email.
Related services
Should I use 16S amplicon or shotgun metagenomics?
Amplicon reads one marker gene. Shotgun reads all the DNA in the sample. Amplicon tells you who is there and how communities differ between groups, and it reaches fungi and other eukaryotes on their own markers. Shotgun gives species names, the genes the community carries and draft genomes. If your question is whether your groups differ and which organisms drive it, amplicon answers it. If the genes themselves are the result, you need shotgun. We say which one fits before you order, including when that means talking you out of the more expensive one.
Which 16S region should I sequence?
V3 and V4 together is our default for bacteria, because it names a wide range of groups and suits 300-letter read pairs. Fungi are read on ITS, other eukaryotes on 18S, and animal traces in water or sediment on COI. Which one is right depends on the organisms you care about, so we settle it at the design review instead of running a default on something it does not suit.
Does the region I pick change my results?
Yes. Every primer pair sits on a stretch that is the same in most bacteria, but no pair matches every group equally well, so some groups are read better than others depending on the region. That is why one sample can give a somewhat different picture from different regions. Two rules follow from it. Use one region for every sample in a study, and be careful comparing your numbers against a study that used a different one.
Can one project cover bacteria, fungi and animals at once?
Yes. Each marker is copied and sequenced separately and gets its own tables, diversity results and comparisons, inside the same project. That is usually faster than running them as separate projects, and the figures come back as one set.
Will I get species names, or only genus?
Genus most of the time. The stretch of 16S being read is short, and many close species carry the same sequence in it, so there is nothing in the data to separate them. Where a variant does match one species cleanly we report it, and where it does not we stop at the level the data supports rather than guess. If species names are the point of the study, shotgun metagenomics is the right method.
Does 16S find archaea?
Some, but how well depends entirely on the primers. Archaea carry the 16S gene too, and some primer pairs pick them up well while others barely touch them. If archaea are part of your question, say so at the design review so the primers are chosen for it, instead of treating whatever turns up as the answer.
My samples are plant tissue. Will plant DNA swamp the result?
It is a real problem and it is worth planning for. Plant chloroplasts and mitochondria carry their own 16S-like genes, and the bacterial primers copy those too, so a large share of the reads from leaves, roots or bark can come from the plant rather than from bacteria. Those reads are recognised and removed during analysis, and the depth is set knowing they will be there. Tell us the tissue at the design review, because leaves, roots and bark do not behave the same way.
How deep should I sequence?
Amplicon needs far fewer reads than shotgun, because one short gene is read instead of whole genomes. How many you need still depends on how many different organisms are in the sample and on whether the rare ones matter to you. A gut study and a soil survey are not the same job. We set the depth at the design review and write it into the quote.
How many samples do I need in each group?
It depends on how big the real difference between your groups is and on how much your samples vary from each other. Microbiome communities vary a lot between individuals, so a difference that looks obvious in a pilot can vanish when the numbers are too small. More samples usually buy you more than more reads per sample do, once the depth is enough to see the community. We look at your pilot data or at published work on the same system and tell you before you order whether your numbers can answer your question.
Can I send samples in batches, or add some later?
Yes, with one condition. Samples extracted, copied and sequenced at different times can pick up a technical difference, and if a whole group sits in one batch, that difference cannot be separated from the biology afterwards. So we spread your groups across the batches. Tell us at the start if samples arrive over months and the plan is built around it.
Can I compare new samples with 16S data I already have?
It depends on how the old data was made. Same region and same primers makes the comparison reasonable, and exact sequence variants help, because they are literally the same sequences in both datasets rather than clusters that shift from run to run. A different region or different primers puts a technical difference inside whatever you find. We tell you which case you are in and what the comparison can support.
How should I collect and store samples?
Storage changes the community you measure, so the thing that matters most is that every sample in a study is treated the same way. Freezing without a buffer is the usual reference point, and preservation buffers exist for when freezing is not possible, each with its own effect on the profile. Mixing methods inside one study is what to avoid. Tell us how collection will work before you start and we will tell you what it means for the data.
Can you extract the DNA, or must I send extracted DNA?
Either. Sending raw samples means they all go through one extraction in one place, which takes a source of difference out of the study. If you extract yourself, use one kit and one protocol for every sample, and tell us which.
My samples have very little DNA. Should I still send them?
Yes. Most of what we receive is below 1 ng per microlitre and sequences fine, because the marker gene is copied many times before sequencing. Every sample is checked before library preparation, so if one is going to struggle you hear about it while it is still cheap to deal with instead of after the run.
Does the extraction method change which microbes I see?
Yes. Bacteria with thick cell walls need harder physical breaking to release their DNA, so a gentle method under-reports them and a harsher one picks them up. This matters most when samples in one study went through different methods, because then part of the difference you measure is the method. One method across the whole study is worth more than finding the perfect method.
Does 16S also read DNA from dead cells?
Yes. The method copies DNA, and DNA from dead cells can persist, especially in soil and in treated or processed samples. So the profile tells you what DNA is present, not what was alive at that moment. If being alive is central to your question, say so at the design review and we will tell you what the data can and cannot show.
Do the percentages tell me how many bacteria there are?
Not directly, and this catches a lot of papers out. Different bacteria carry different numbers of copies of the 16S gene, from one to more than ten depending on the species. A species with many copies produces more reads than a species with one copy even when the number of cells is identical. So the read share is a share of genes, not a share of cells. We report it as what it is, and we compare the same organism across your groups, where that bias cancels out.
Can I get real cell numbers from 16S?
Not from amplicon data alone, for the reason above. If bacteria per gram is the actual question, shotgun metagenomics with a spike-in control answers it, because a known number of cells is added before extraction and read shares can then be converted into counts. We raise this at the design review rather than letting you discover it when a reviewer asks.
Why do percentages cause problems in the statistics?
Because they are shares of a fixed total. When one organism becomes more common, everything else drops as a share even though nothing happened to it. Run a plain t-test on those shares and you get findings that are not real. We use methods built for this kind of data, which is also what reviewers now expect to see in the Methods.
Do you report ASVs or OTUs?
Exact sequence variants. An OTU is a cluster of sequences similar enough to be grouped, and where that boundary falls depends on the run and the settings. A sequence variant is the actual sequence found in the data, so it means the same thing in your study and in anyone else’s, and your data stays usable when you add samples later.
Which reference database do you use, and does it matter?
It matters, which is why it is a choice rather than a default. SILVA is our usual starting point for 16S and 18S, UNITE is the one for fungal ITS, and Greengenes2, the NCBI 16S set and others are used when the study calls for them, including when you need to match the database an earlier study used. Databases differ in what they hold and in how names are assigned, and names change between releases, so the same sequence can come back under a different name a year later. We pick with your samples and your comparisons in mind, and the database with its version goes into the Methods, which is what makes the result repeatable.
Why are some variants not named all the way down?
Because no close enough match exists in the database, which is common and is not a fault in your data. Plenty of environmental microbes have never been described. We report each variant at the deepest level the data supports and stop there instead of pushing a name the match does not justify. Unnamed variants still count in the diversity results and in the group comparisons, and if one turns out to matter in your result it can be followed up.
How do you decide a microbe changed between groups?
Every organism in the table is tested, so p-values are corrected for the number of tests. We use methods made for compositional data rather than a plain t-test, and you get the result at more than one cut-off so you can see which findings hold up under a stricter one. Whether the community as a whole differs is tested separately, on the distances between samples.
Do you rarefy the data?
It depends on the analysis. Samples come off the sequencer with different numbers of reads, and some measures, richness above all, climb with depth, so for those the depth has to be levelled before samples can be compared. For testing which organisms changed we use methods that handle uneven depth themselves instead of throwing reads away. Whatever is done goes in the Methods.
Can amplicon data tell me what the microbes do?
As a prediction, not a measurement. The method looks up which genes relatives of your organisms are known to carry and estimates from there. It works better in well studied systems like the human gut than in soil or in unusual environments, and it carries the copy number bias along with it. It is a fair way to build a hypothesis. If the genes themselves are the result you need to publish, that is shotgun metagenomics.
What do I actually get back?
Cleaned reads, a table of exact sequence variants with names, composition at every level from phylum to genus, diversity for each sample, a community map with a test for group differences, and the list of organisms that changed. Predicted functions, several markers side by side, networks and machine learning are added when your question calls for them. You also get figures and a Methods section written for a journal, plus any other analysis the project needs. The analysis is part of the project rather than a separate line on the quote, and there is no cap on it.
Is the analysis reproducible?
Yes. Tool versions, database version, primer sequences and settings go into the Methods, and you get the input files alongside the results. For amplicon work the primers and the database version matter most, because those two things decide what gets read and what it gets called.
A reviewer asks for another analysis later. What then?
You ask and we run it. Reviewer re-analysis is covered by the project guarantee and costs you nothing. If you asked us to keep your data we hold it for up to five years, so it does not start with you hunting for the raw files.
Start the project that ends in a paper.
One sentence will do. What the samples are and what you need to know. A scientist handles the rest.
- [email protected] Projects, samples and invoices
Start without committing to anything
- One sentence to start
- A short call to get the details
- A design, with the reasoning behind it
- Free shipping worldwide
- Free pre-analysis if you qualify
- Nothing starts until you agree