
Shotgun metagenomics: the species in your samples, and the genes they carry.
We sequence all the DNA in a sample, not just one marker gene. That names microbes down to species, shows which gene functions they carry and can turn percentages into cell counts.
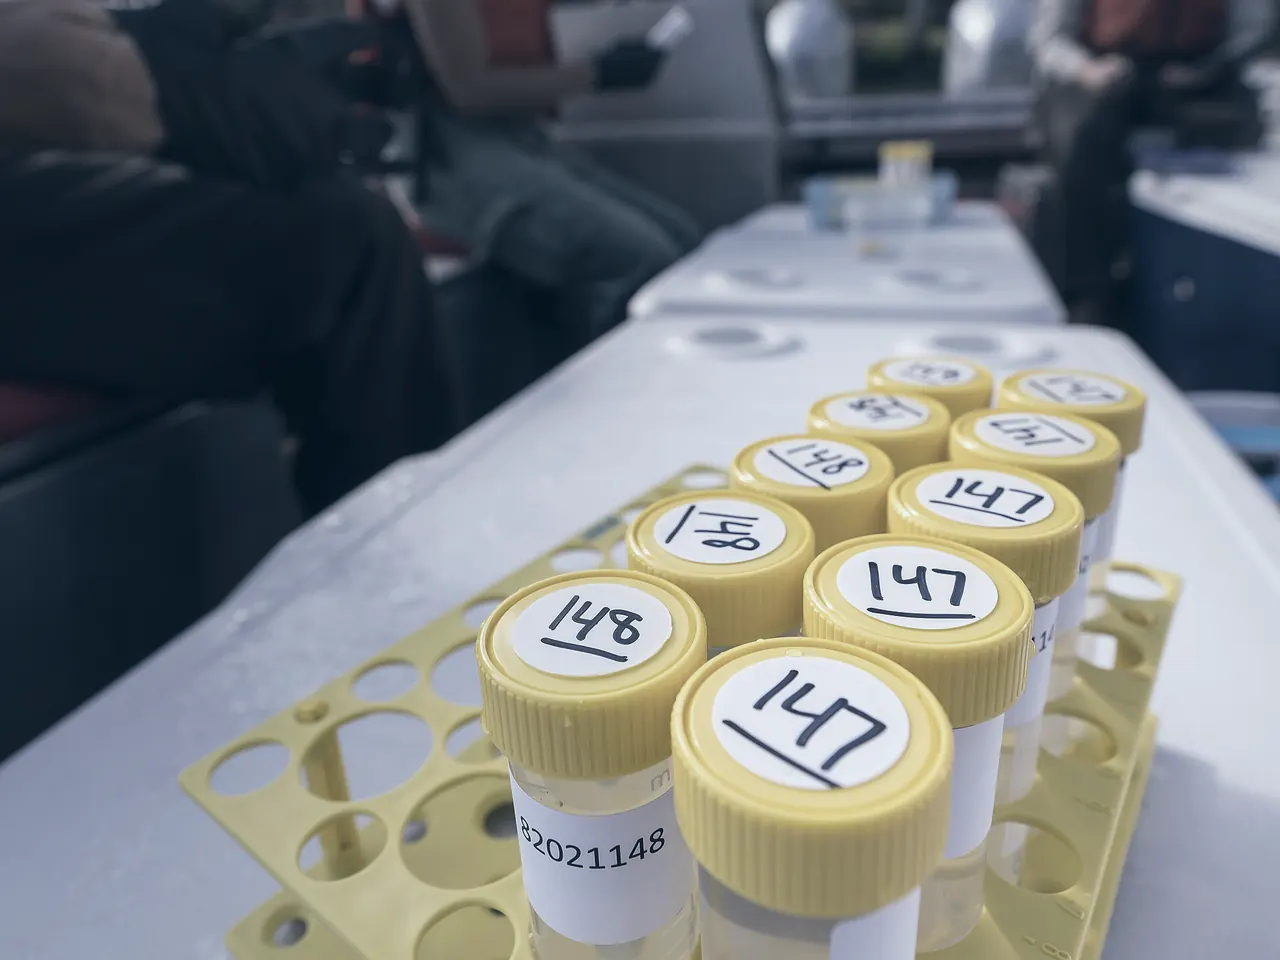
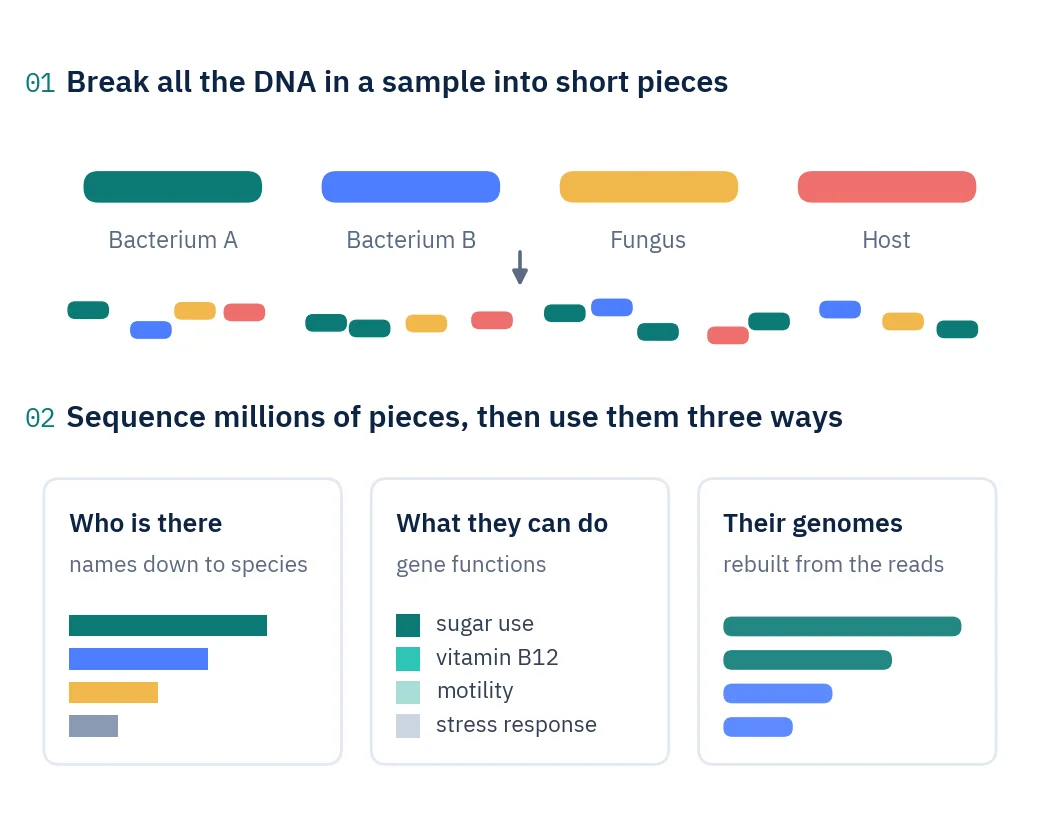
Read everything, then sort it out.
Shotgun sequencing breaks all the DNA in a sample into millions of short fragments and reads them at random. There is no primer and no marker gene, so bacteria, archaea, fungi and DNA viruses all end up in the data, together with DNA from the host.
Each read is compared against reference databases of complete genomes to name the organism it came from. Because the reads cover whole genomes rather than a short marker, microbes can be named down to species.
The same reads answer more questions. Matched against catalogues of gene functions, they show what the community is equipped to do. Assembled into longer stretches and sorted by organism, they rebuild draft genomes of microbes that nobody has cultured.
Sequencing gives shares of reads. Adding a known number of spike-in cells to each sample before DNA extraction turns those shares into cells per gram.
Key terms
- Metagenome
- All the DNA from all the organisms in one sample, read together.
- Read pair
- Two short reads, 150 letters each, from the two ends of one DNA fragment.
- Host DNA
- DNA from the person, animal or plant the sample came from. It uses up sequencing depth.
- Taxonomic profile
- A list of the organisms in a sample and the share of reads each one gets.
- MAG
- A metagenome-assembled genome: a draft genome of one microbe rebuilt from a mixed sample.
- Spike-in control
- A known number of foreign cells added to a sample so that read shares can be turned into cell counts.
Bring the question. We design the experiment around it.
- Which species are more or less common in my treated group than in controls?
- Which gene functions does the community carry, and which differ between groups?
- Did the total number of bacteria per gram change, or only their proportions?
- Can I recover genomes of microbes that nobody has cultured?
Where it is used
- Gut microbiome cohortsSpecies-level profiles across patients, diets and time points.
- Treatment and intervention studiesWhich species and gene functions shift after a drug, probiotic or diet.
- Diet and host from faecal DNAWhich host species and which plant families show up in faecal samples.
- Environmental samplesSoil, sediment, water and surfaces, including organisms that cannot be cultured.
- Samples with very little DNACleanroom swabs and other low-biomass material.
- Absolute microbial loadCells per gram, when you need to know whether bacteria truly grew or declined.
Four steps from sample to figures.
- Step 1
Plan depth and controls
We set the sequencing depth for your sample type, since host-rich samples need more reads, and decide whether spike-in controls are needed.
- Step 2
Check the DNA
Every sample is checked before library preparation, so problems show up while they are still cheap to fix.
- Step 3
Sequence
All the DNA is fragmented and sequenced as 150-letter read pairs.
- Step 4
Analyse and report
Species profiles, diversity and group comparisons, plus gene functions and genomes when the question needs them, with figures and a Methods section.
What the analysis shows you.
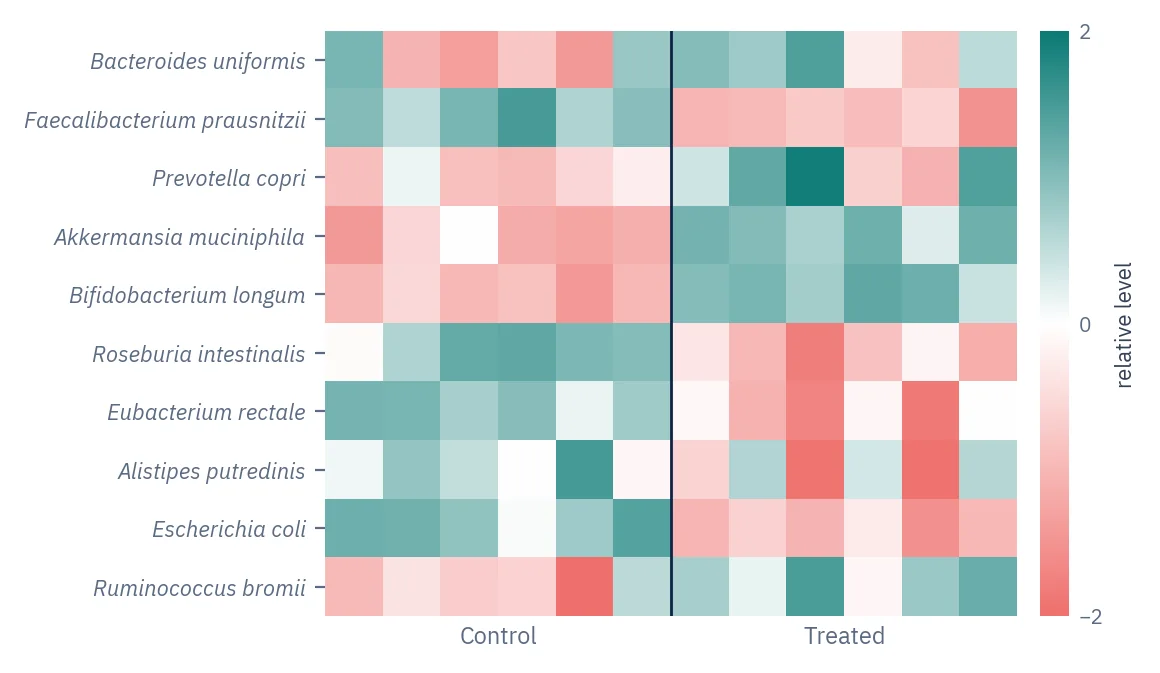
Species across samples
Each row is a species, each column a sample. Teal means more than that species’ average, coral means less, so group differences stand out.
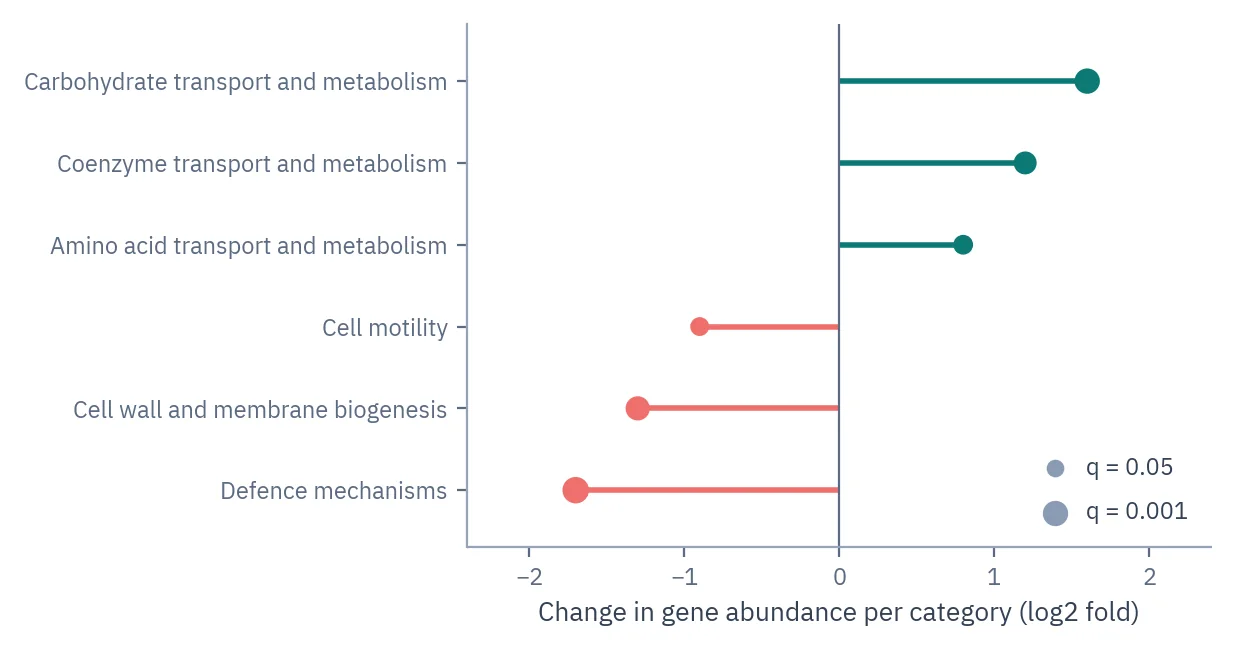
Gene functions that changed
Genes grouped into function categories and compared between groups. Bigger dots mean stronger statistical evidence.
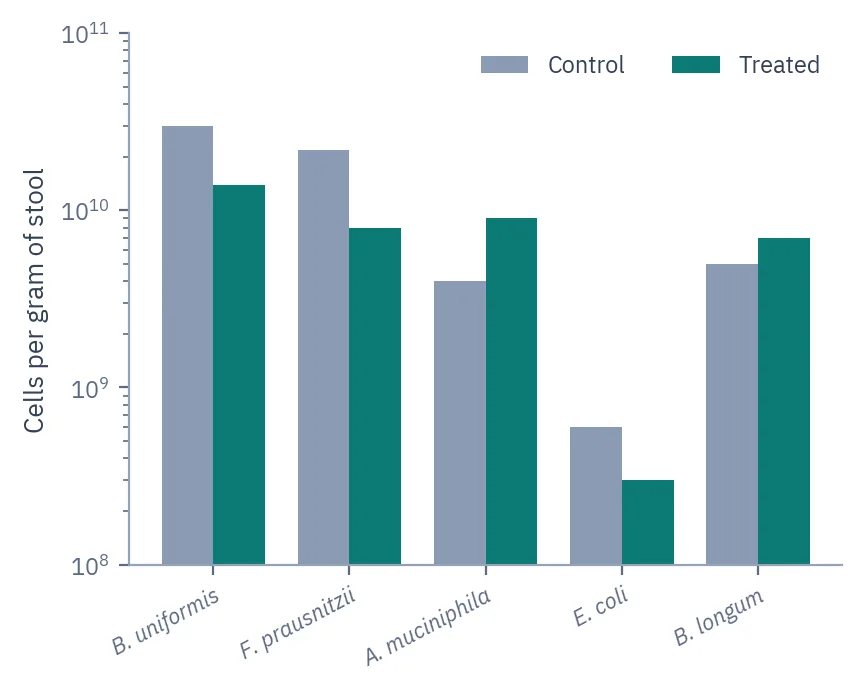
Cells per gram
Spike-in controls turn read shares into cell counts, so you see whether a microbe truly declined or only looks smaller because others grew.
Included as standard every project
- Quality filteringLow-quality bases and adapter sequence are removed before analysis.
- Species-level profilesEvery read is matched against reference genomes, and abundances are estimated down to species.
- Composition tables at every levelCounts and shares from kingdom to species, as spreadsheets and charts.
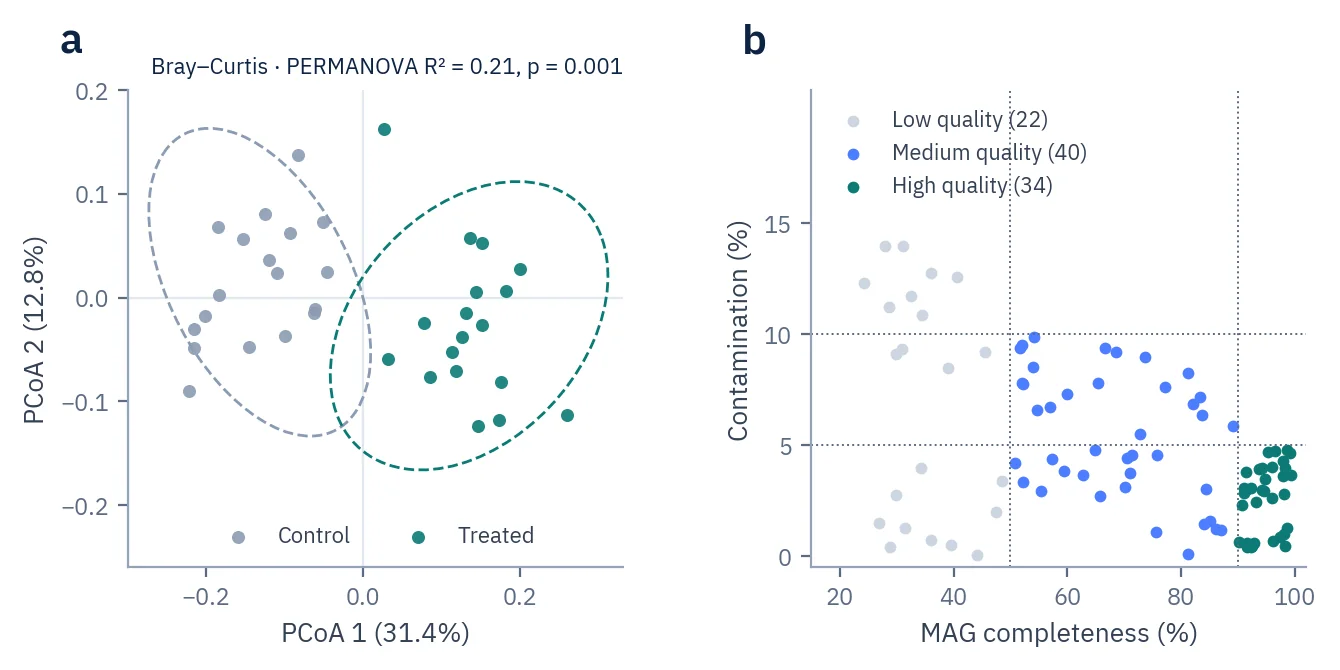
- Diversity and community mapRichness per sample, and a map of how similar samples are, with a test for group differences.
- Differential abundanceWhich species changed between groups, corrected for testing many at once.
Added for your question custom
- Gene functionsGenes matched to function catalogues (KEGG orthologs, COG categories) and compared between groups.
- Genomes from the mixtureDraft genomes rebuilt from the reads, checked for completeness and contamination, and named.
- Absolute countsSpike-in controls convert read shares into cells per gram.
- Host and dietHost species and diet plant families identified from faecal DNA.
- Confirmation of key hitsA second classification and a genome-coverage check show whether a flagged organism is really there.
- Resistance genes and strainsAntibiotic resistance genes, virulence factors and strain-level differences.
- Networks and predictionCo-occurrence networks and machine-learning classification of groups.
What goes in, and how we run it.
- Sequencing
- Illumina, 150 bp read pairs
- Depth
- Set per project from the sample type, the host content and the question
- Samples
- Stool, soil, sediment, water, swabs, tissue, cleanroom and low-biomass samples
- Input
- Extracted DNA or raw samples · low-input samples accepted
- Cell counts
- Spike-in controls added before DNA extraction, on request
- Main tools
- Kraken2, Bracken, MEGAHIT, CheckM2, GTDB-Tk, eggNOG
Figures, interpretation and Methods, ready for the manuscript.
- ReportInterpretation written against your hypothesis
- FiguresPublication-ready figures for the manuscript
- MethodsMaterials & Methods text for the paper
- Tables and dataAll results as tables, plus the processed data files
Shotgun or amplicon?
Bring the question to the call and the scientist recommends one, with the reasoning for your samples.
| Aspect | Shotgun metagenomics | Amplicon sequencing |
|---|---|---|
| What is read | All DNA in the sample | One marker gene |
| Naming depth | Species | Usually genus |
| Function | Read from the genes themselves | Predicted from who is there |
| Extra outputs | Draft genomes, cell counts, host and diet | Fungi, protists and animals on their own markers |
| Best when | Genes, genomes or species-level detail matter | Many samples and a tight budget per sample |
Straight answers before you email.
Related services
How deep should I sequence?
There is no single number. It depends on three things: how much of your sample is host DNA rather than microbial, how many different organisms are in it, and what you want out of the data. Naming the common species takes far fewer reads than rebuilding genomes, catching rare organisms, or hunting for genes and enzymes that nobody has described yet. We set the depth for your sample type at the design review and write it into the quote, so it does not go up later.
My samples have a lot of host DNA. What happens to my data?
Host reads are recognised as host and set aside, so they are never counted as microbes. They do still take up room in the run, which is why host-heavy samples need more reads to reach the same microbial depth. We ask what the sample is before setting the depth, so this gets planned instead of discovered afterwards.
How many samples do I need in each group?
It depends on how different your groups really are and how much your samples vary from each other. Microbiome data varies a lot between individuals, so community studies often need more samples than people expect. We look at your pilot data or at published work on the same system, and we tell you before you order whether your planned number can answer your question.
Should I use shotgun or 16S amplicon sequencing?
Use amplicon when the cost per sample has to stay low and genus-level answers are enough. Use shotgun when you need species names, the genes the community carries, draft genomes, or organisms that no single marker gene covers. Sometimes the honest answer is amplicon, and we will say so if that is the case for your question.
Can I send samples in several batches, or add some later?
Yes, but plan it as part of the design. Samples extracted and sequenced months apart can carry a technical difference, and if all of one group arrives in the first batch, that difference cannot be separated from the biology afterwards. If you know your samples come in waves, we lay out the batches so each one holds all of your groups.
Can you extract the DNA, or must I send extracted DNA?
Either. Sending the raw sample means extraction happens in one place with one method, which removes a source of difference between your samples. If you extract yourself, tell us the kit and whether it includes bead beating, because that changes which organisms you see.
Does the extraction method change which species I see?
Yes, more than most people expect. Bacteria with thick cell walls need harder physical breaking to release their DNA. A gentle method under-reports them and over-reports the ones that open easily. This matters most when samples in one study were extracted in different ways, because then the difference you measure may be the method rather than the biology.
Does shotgun also read DNA from dead cells?
Yes. Sequencing reads DNA, and DNA does not disappear the moment a cell dies. In soil, sediment and treated samples, part of what you measure can come from cells that are no longer alive. If your question is about what is alive and active right now, we will tell you what the data can and cannot show before you run it.
Can you work with soil, water and sediment?
Yes. Environmental samples bring their own problems. Soil carries compounds that block the enzymes used in library preparation, and water usually has to be filtered to collect enough material. Tell us the matrix and roughly how much you have, and we will say what is needed before you ship anything.
Which organisms does shotgun find?
Bacteria, archaea, fungi, protists and DNA viruses, all from the same data, because no primer or marker gene decides what gets read. How well a given group shows up depends on how much of it is in the sample and on how deep you sequence, since the rare members only appear once there are enough reads to catch them.
Will I see viruses in my data?
DNA viruses yes, RNA viruses no. Shotgun metagenomics sequences DNA, and an RNA virus leaves no DNA in the sample to read. If RNA viruses are part of your question, that is a different experiment, and we will say so at the design review rather than let you find out from the results.
Can you detect antibiotic resistance genes?
Yes. Reads are matched against resistance gene databases first, which gives you the known genes and how they differ between your groups. With enough depth we can also assemble draft genomes from the community and compare their predicted proteins with known resistance proteins by similarity, which turns up candidates no exact match would find. They stay candidates until tested in the lab, because similarity does not prove that a gene confers resistance. Linking a gene to the organism carrying it works when the gene sits on a chromosome. Genes on plasmids often cannot be assigned this way, so tell the scientist early if that link matters, because it changes the method rather than the depth.
Can you tell strains of the same species apart?
Sometimes. Strain-level work needs more depth than species-level profiling, and the strain has to be common enough in the sample to be seen at all. We tell you at the design review whether your samples and your depth can support strain-level claims, instead of reporting strains the data cannot really separate.
How do I know a species you report is really there?
Read classification makes mistakes, especially for species that are close relatives of something genuinely present. For any result you plan to build a claim on, we check it a second way: a different classifier, and a look at whether the reads spread evenly across that organism’s genome or pile up in one spot. A real organism gives even coverage. A false hit usually does not.
Which reference database do you use, and does it change the answer?
It changes the answer a lot, which is why it is a decision rather than a default. A bigger database names more of your reads but also produces more false hits among close relatives. A database built for your kind of sample names fewer reads and gets more of them right. We record the database and its version in the Methods, so the result can be repeated later.
Can I get real numbers instead of percentages?
Yes, with a spike-in control. A known number of foreign cells is added to each sample before DNA extraction, and because you know how many went in, read shares can be turned into cells per gram. This has to be decided before extraction rather than afterwards, so raise it while we are planning.
Why do percentages cause problems in the statistics?
Because they always add up to one hundred. If one species doubles, every other species drops as a share of the total, even though nothing happened to them. A figure built on percentages can therefore show declines that never occurred. This is the most common reason reviewers push back on microbiome papers. We use methods built for this kind of data, and when the question is really whether something grew or shrank, spike-in controls answer it directly.
How do you decide a species changed between groups?
Every species in the table is tested, so p-values are corrected for the fact that hundreds of tests ran at once. We use methods designed for compositional data rather than a plain t-test, because a plain test gives false results on this kind of data. You get the result at more than one cut-off, so you can see which findings survive a stricter threshold.
Can you rebuild genomes of microbes nobody has cultured?
Yes. The reads are assembled into longer pieces, those pieces are sorted into bins that each look like a single organism, and each bin becomes a draft genome. This is how most new microbial genomes are described now, because the great majority of microbes have never been grown in a laboratory.
How good are those rebuilt genomes?
They vary, and we report the numbers rather than just handing you files. Each draft genome gets a completeness score and a contamination score, so you know how much of the organism was recovered and how much probably came from something else. The high-quality label in the community standard also asks for the rRNA genes and a set number of tRNAs to be present. How many good genomes you get depends on depth and on how even the community is.
Will I learn what the community actually does, not just who is there?
You learn what it is equipped to do. Genes are read straight from the DNA and matched to function catalogues, so you see which functions are present and which differ between groups. What DNA cannot tell you is which of those genes were switched on when you took the sample. That needs RNA, and we will say so if your question really needs it.
Can you tell me what the host ate, from faecal samples?
Yes, in many cases. Faecal DNA holds the host’s own DNA and DNA from what it ate, so host species and plant families can be identified alongside the microbes. How well it works depends on how processed the food was and on whether reference sequences exist for the species involved.
Can you compare my data with a published dataset?
Yes, but with a warning. Another study’s samples were collected, extracted and sequenced differently, and every one of those leaves a mark that is mixed up with the comparison you want to make. We can reduce it, and we will tell you what the comparison can and cannot support rather than producing a figure that claims more than it should.
What do I actually get back?
Cleaned reads, a table of who is present at every level from kingdom to species, diversity for each sample, a map showing how similar your samples are with a test for group differences, and the list of species that changed. Gene functions, draft genomes, resistance genes and cell counts are added when your question needs them. You also get figures and a Methods section written for a journal, plus any other analysis your project needs. The analysis is included in the project rather than quoted on top, and there is no limit on it.
Is the analysis reproducible?
Yes. Tool versions, database versions and settings go into the Methods section, and you get the input files as well as the results. Database version matters more here than in most fields, because the same reads classified against a different release can give a different answer.
A reviewer asks for another analysis six months later. What then?
You ask, and we run it. Reviewer re-analysis is covered by the project guarantee and costs you nothing. If you asked us to keep your data, we hold it for up to five years, so the request does not start with you uploading the raw files again.
Start the project that ends in a paper.
One sentence will do. What the samples are and what you need to know. A scientist handles the rest.
- [email protected] Projects, samples and invoices
Start without committing to anything
- One sentence to start
- A short call to get the details
- A design, with the reasoning behind it
- Free shipping worldwide
- Free pre-analysis if you qualify
- Nothing starts until you agree