
ddRAD sequencing: genetic markers that show how your populations and lines are structured.
We read the same small part of the genome in every individual, find the SNP markers that vary, and analyse structure, diversity and relatedness. The markers can also become a custom SNP array.
Read the same slice of the genome in every individual.
Sequencing whole genomes of hundreds of individuals is expensive, and most population questions do not need it. ddRAD reads only a small, fixed part of the genome, but the same part in every individual, so the results can be compared directly.
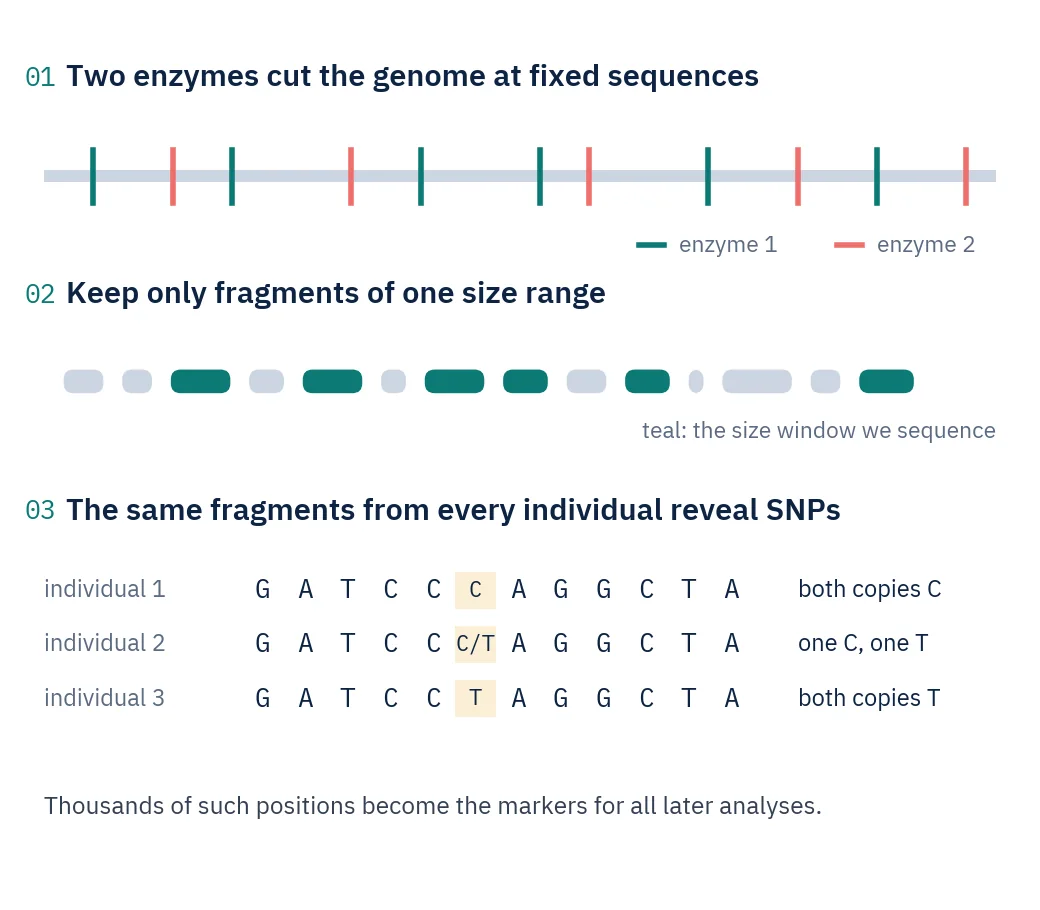
Two restriction enzymes cut the DNA wherever they find their short target sequences. The lab keeps only fragments within a narrow size window. Because the cut sites are nearly the same in every individual, nearly the same fragments come back from each. Where a mutation sits inside a cut site, that fragment is missing from that individual, so how much data is missing is measured rather than assumed away.
Reads from those fragments are compared across individuals. Positions where individuals carry different letters are SNPs, and each individual’s genotype at thousands of SNPs becomes the data for structure, diversity and relatedness analyses.
Before any lab work, the enzymes are tested on a computer: we cut the reference genome in silico with candidate enzyme pairs and predict how many fragments fall into the size window.
Key terms
- Restriction enzyme
- A protein that cuts DNA wherever it finds one specific short sequence.
- Size selection
- Keeping only DNA fragments of a chosen length, so the same pieces are compared across individuals.
- SNP
- A single DNA letter that differs between individuals, for example A in some and G in others.
- Fst
- A measure from 0 to 1 of how genetically different two populations are. Higher means more different.
- Heterozygosity
- The share of positions where an individual carries two different versions. Low values can signal inbreeding, or alleles dropping out of the data.
- Kinship
- How closely two individuals are related, from duplicates to unrelated.
Bring the question. We design the experiment around it.
- How many genetically distinct populations do I have?
- How different are my sampling sites or breeding lines from each other?
- Is diversity dropping, or is there inbreeding in this population?
- Are some samples duplicates, siblings or close relatives?
Where it is used
- Breeding programmesStructure, diversity and relatedness in broodstock, breeds and breeding lines.
- Population geneticsHow populations are structured and how different they are.
- Conservation geneticsDiversity and inbreeding in small or isolated populations.
- SNP array designTurning discovered markers into a custom genotyping array for routine screening.
- Species without a genomeLoci built directly from the reads when no reference genome exists.
- Enzyme screeningHow many loci candidate enzyme pairs give for your genome, before any lab work.
Four steps from DNA to population answers.
- Step 1
Pick the enzymes
We simulate digests of your reference genome, or a related one, and choose the enzyme pair and size window.
- Step 2
Check the DNA
ddRAD needs intact DNA, so amount and integrity are checked before library preparation.
- Step 3
Build libraries and sequence
Every individual’s DNA is cut, size-selected, barcoded and sequenced.
- Step 4
Call SNPs and analyse
SNPs are called with three independent methods, every individual is genotyped at every site, and the markers go into the population analyses.
What the analysis shows you.
Choosing enzymes before sequencing
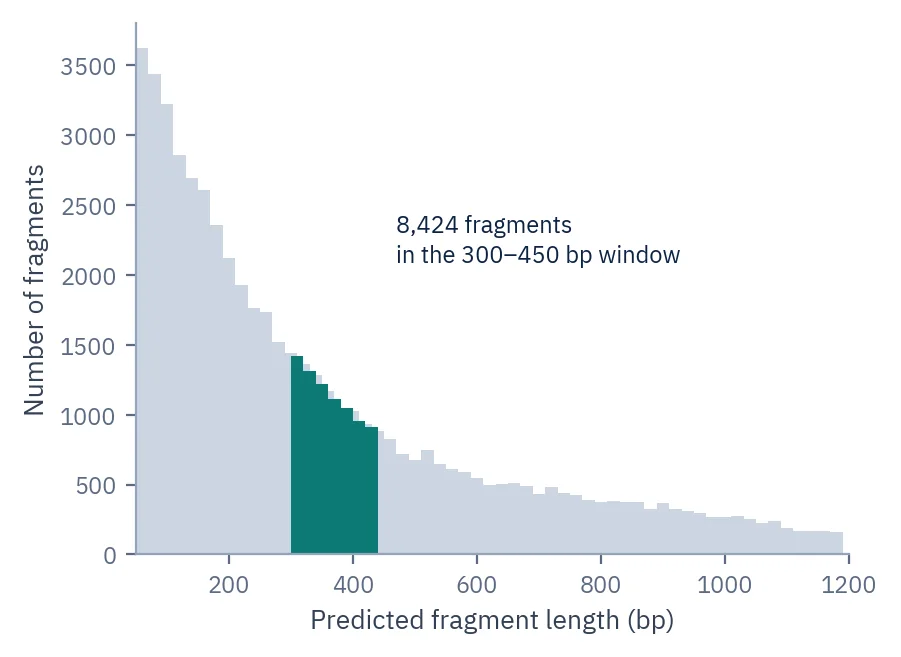
A simulated digest of the reference genome. The teal window marks the fragments that would be sequenced, and the label gives how many there are.
How different are the populations?
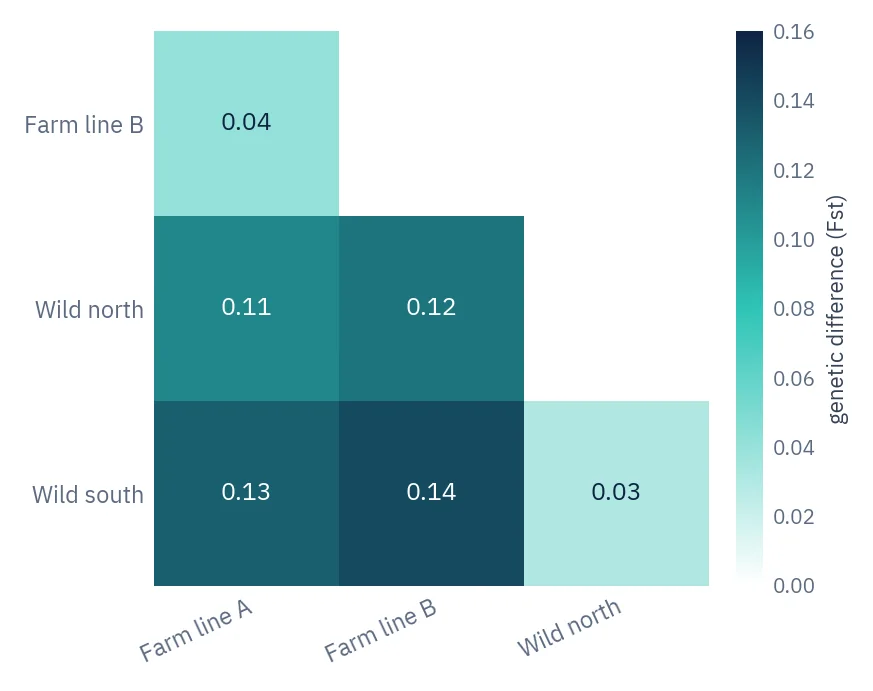
Pairwise Fst between four populations. Darker cells mean stronger genetic differences; here the farmed lines differ clearly from the wild ones.
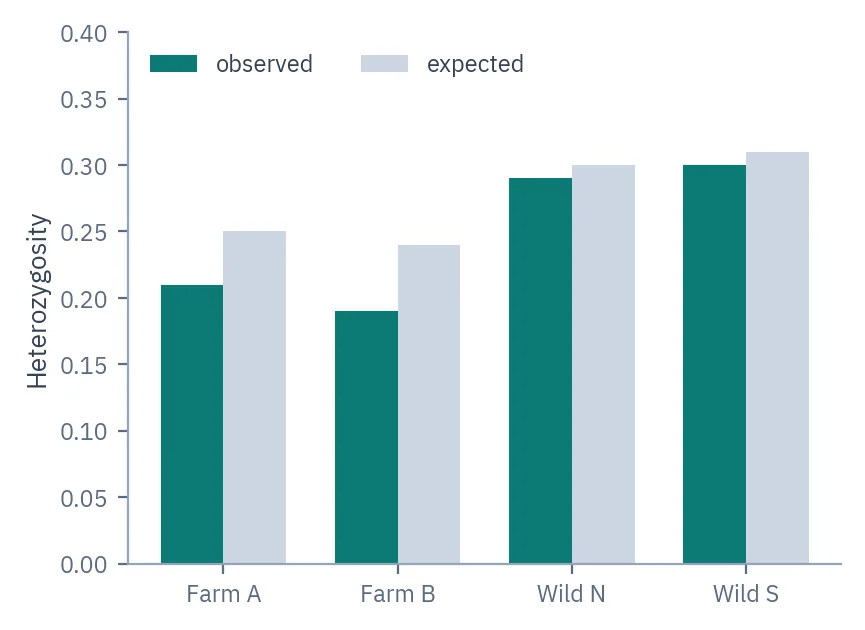
Genetic diversity per population
Observed against expected heterozygosity. A deficit like the one in the farmed lines is worth investigating: inbreeding, hidden population structure and alleles dropping out of the data all produce it.
Included as standard every project
- Read quality control and alignmentReads are trimmed and placed on the reference genome.
- Consensus SNP callingSNPs called with three independent callers and kept where they agree.
- Cohort genotypingEvery individual genotyped at every agreed site, so a site is not scored only in the individuals where it happened to be called.
- Marker filteringUnreliable SNPs removed, and linked markers thinned before structure analyses.
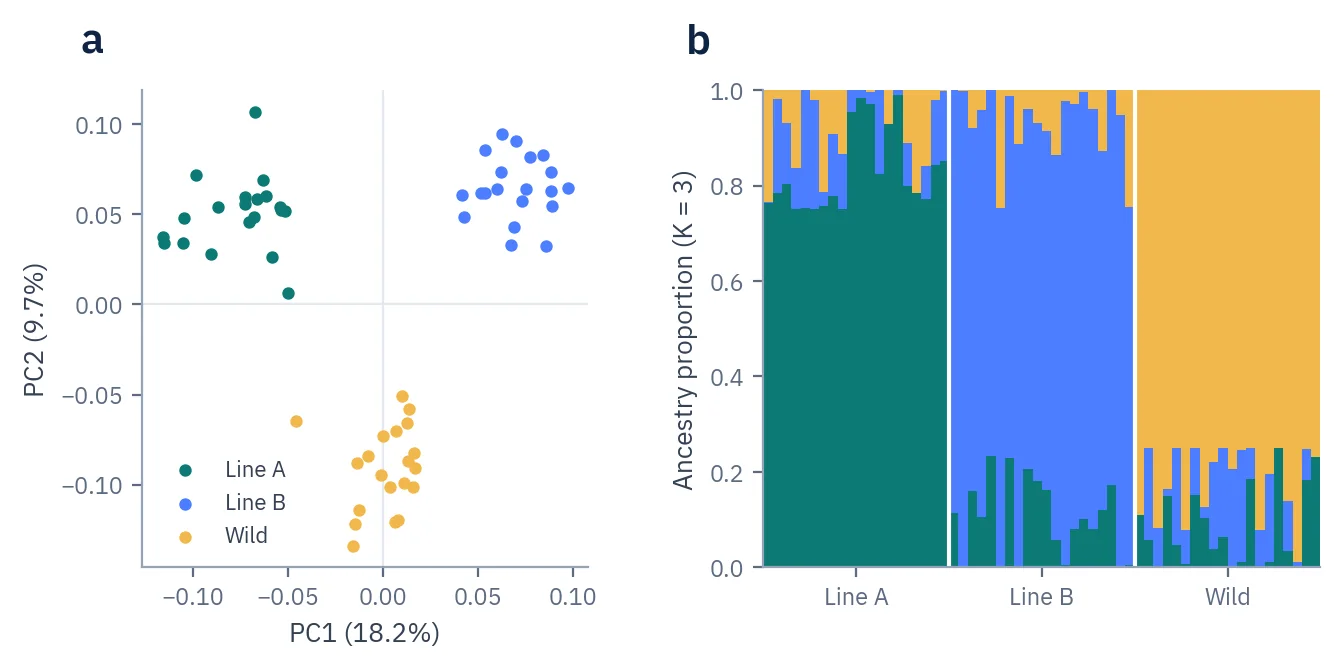
- Population analysesPCA, ancestry proportions, Fst, heterozygosity and a genetic tree.
Added for your question custom
- KinshipPairwise relatedness to find duplicates, siblings and parent–offspring pairs.
- SNP array designArray-ready marker sequences, one SNP per locus, with nearby interfering SNPs flagged.
- Enzyme screening for new genomesDigest simulations on any reference genome before the lab work starts.
- Analysis without a referenceLoci assembled directly from the reads when no genome is available.
What goes in, and how we run it.
- Method
- ddRAD with an enzyme pair chosen for your genome
- Before sequencing
- In-silico digest predicts how many loci each enzyme pair gives
- Sequencing
- Illumina
- Samples
- Tissue, blood, shrimp, insects and plants
- Markers
- Tens of thousands to hundreds of thousands of SNPs, depending on genome and enzymes
- Main tools
- Stacks, bwa-mem2, nf-core/sarek, ADMIXTURE, plink2
Figures, interpretation and Methods, ready for the manuscript.
- ReportInterpretation written against your hypothesis
- FiguresPublication-ready figures for the manuscript
- MethodsMaterials & Methods text for the paper
- Tables and dataAll results as tables, plus the processed data files
ddRAD or whole-genome resequencing?
Bring the question to the call and the scientist recommends one, with the reasoning for your samples.
| Aspect | ddRAD | Whole-genome resequencing |
|---|---|---|
| Markers | Tens of thousands to hundreds of thousands of SNPs | Millions of variants across the genome |
| Cost per individual | Low, so large cohorts fit | Higher per individual |
| Reference genome | Not required | Required |
| Best when | Population structure, diversity, relatedness and array design | Every variant matters, including rare ones |
Straight answers before you email.
Related services
How is ddRAD different from sequencing whole genomes?
ddRAD reads the same small slice of the genome in every individual instead of all of it. Two restriction enzymes cut the DNA at their specific target sequences, and only fragments in a chosen size window are kept. Because the cut sites sit in nearly the same places in every individual, nearly the same fragments come back from each one, so genotypes can be compared directly. You get tens of thousands of markers per individual rather than millions, which is usually plenty for structure, diversity and relatedness, and it lets you work with far larger cohorts.
Can ddRAD find the genes under selection in my populations?
Treat that one carefully. ddRAD samples a small fraction of the genome, and not an even fraction, because markers sit wherever the enzymes happen to cut, so a gene under selection is found only if a marker lands close enough to it. There is also a specific trap: if a mutation inside a cut site is common in one population and rare in another, the locus is recovered unevenly between them and the pattern can imitate selection. For diversity, structure and relatedness this is a smaller problem and one we measure. For adaptive questions we usually suggest whole-genome data, or RNA sequencing if the tissue involved can be collected and preserved properly.
Do I need a reference genome for ddRAD?
No. Loci can be built directly from the reads, by grouping reads that look alike into loci and comparing those across individuals. That is how ddRAD works in species nobody has sequenced, which is a large part of why the method exists. A reference from your own species does help: it places markers on chromosomes, makes genotype calling more reliable, and lets you handle markers that sit close together. If one exists we use it. If it does not, we build the loci from the data and say what that means for the results.
How do you choose the restriction enzymes for ddRAD?
On a computer first, before anything is cut in the lab. We take the reference genome for your species, cut it digitally with candidate enzyme pairs and size windows, and count how many fragments fall inside each one. That number sets the rest of the design. A pair giving fewer fragments means each one can be read more deeply for the same amount of sequencing, and a pair giving more fragments spreads the reads thinner. So the sequencing depth is set from the fragment number together with your question: relatedness and parentage need fewer markers read well, while structure and diversity work usually want more.
Why does the size selection window matter so much in ddRAD?
Because it sets how many fragments end up in your library, and it has to be calibrated for each enzyme pair separately. The same window applied to a different pair gives a different number of fragments, so the window and the pair are chosen together rather than one after the other. It also has to be applied the same way to every individual, because the markers are only comparable if the same fragments were kept in each one. That is why the window is fixed during the design and then used identically across all the libraries.
Will you test the enzymes and size window before I commit to anything?
Yes, and it is free. If your species has a reference genome we run the digest simulation on it for candidate enzyme pairs and size windows, and send you the numbers: how many loci each combination gives, and what that means for reads per individual. If there is no genome for your species, the same numbers come from a small pilot instead. We do this before any project starts, because the enzyme pair and the size window are the two decisions that most often cause a ddRAD study to fail, and both are irreversible once the libraries are built.
How many individuals do I need per population for ddRAD?
It depends on what you are measuring, and it is worth settling before anything is sequenced. Showing that two populations differ needs fewer individuals than estimating how much they differ. Questions about hybrids, admixture proportions or allele frequencies need more, because those rest on estimating frequencies accurately rather than just separating groups. Relatedness and pedigree work follows different rules again. So there is no single right number. On the call we go through your populations, how many samples you can realistically get from each one, and what the result has to show. The number comes out of that.
How many reads per individual does ddRAD need?
It follows from the number of loci, not from a fixed figure. If the enzyme screen says your pair gives ten thousand loci and you want each one read around twenty times, that is roughly two hundred thousand reads per individual before allowing for loss along the way. Treat that as an average rather than a promise, because depth varies a lot between loci, and the loci read most shallowly are where genotyping errors appear. Reading too shallow is the common mistake: heterozygotes get scored as homozygotes and the diversity numbers come out wrong in a direction that is hard to spot afterwards.
How many SNPs will I get from ddRAD?
Two things set it. The enzyme pair and size window decide how many loci get sequenced, and the simulation estimates that before any lab work, though real recovery is always somewhat lower once digestion, size selection and filtering have each removed some. How many of those loci actually vary depends mostly on how diverse your populations are. A highly diverse species gives many SNPs from the same loci, an inbred line gives few. So the loci number is an estimate and the SNP number is a looser one, and the report says which is which.
Can I run a small ddRAD pilot first?
Yes, and for a species nobody has worked on it is often the sensible order. A pilot on a handful of individuals turns predicted numbers into real ones: how many loci actually came back, how deeply they were read, how much data is missing and how variable your population really is. The full design is then built on measurements rather than estimates. If your species already has a reference and published ddRAD work, the simulation alone is usually enough. The scientist says which situation you are in on the call.
What DNA quality does ddRAD need?
Intact DNA, because the method depends on the enzymes cutting where they should rather than where the DNA happened to break. Degraded material gives fewer usable fragments and more missing data, and badly degraded material stops being comparable between individuals. Amount matters too: too little template gives a library with few unique molecules, which shows up as heavy duplication and unreliable genotypes even when the DNA is perfectly intact. Integrity needs a gel or a fragment analyser to see, not a concentration reading. If you do not have either instrument, send us a small amount and we run both checks here. We also do the extraction.
Can you do ddRAD on DNA I already extracted?
Yes, and it is common. Send the DNA with whatever quality information you have, and tell us how it was extracted and how long it has been stored, because both affect how intact it still is. Concentration measured by absorbance is not enough on its own, so we check the fragment sizes here before anything is committed. Extractions done for another purpose are sometimes fine and sometimes too sheared, and it is far better to find that out on a few samples than after a whole plate has been through library preparation.
Can ddRAD miss alleles, and does that matter?
Yes, and it is the known weakness of the method. If a mutation sits inside a cut site, that copy of the chromosome does not get cut. An individual carrying one normal and one mutated copy still produces the fragment, but only from the normal copy, so a real heterozygote gets scored as a homozygote. An individual with the mutation on both copies loses the locus entirely. How much this matters depends on how variable your species is, and in highly polymorphic ones it can be substantial. It is measured, and the report gives missing data per locus and per individual.
How do you build ddRAD loci when there is no reference genome?
Reads are grouped by similarity: reads that look almost the same within an individual are stacked into a locus, then loci are matched across individuals into a shared catalogue. The sensitive part is how much difference is allowed before two reads count as different loci. Set it too tight and real alleles split into separate loci. Too loose and duplicated regions merge into one. The settings are chosen by testing a range and seeing where the number of markers shared across most individuals stops improving. That is a published procedure, run for each dataset, because the right setting differs by species.
Which population analyses do I get from ddRAD?
A genetic map of your individuals from principal components, ancestry proportions per individual across a range of group numbers, pairwise Fst between populations, observed and expected heterozygosity per population, a genetic tree, etc. Each comes with what it does and does not show, because these plots are easy to misread. Ancestry bars in particular depend on the number of groups you ask for, and that number is a choice, not a result. If your question needs something beyond this list, say so on the call and it goes into the design.
Can you design a SNP array from the ddRAD results?
Yes, and it is a common next step once ddRAD has found the markers. We select candidate sequences with one SNP per locus, keep the flanking sequence the probes need, separate markers inside genes from those outside, and flag neighbouring variants that would sit under a probe and interfere with it. Expect some to fail when the array is built, because not every candidate converts into a working assay, so the selection allows for that loss. Tell us what the array is for, because a small panel for parentage and a large one for general use are selected differently.
Start the project that ends in a paper.
One sentence will do. What the samples are and what you need to know. A scientist handles the rest.
- [email protected] Projects, samples and invoices
Start without committing to anything
- One sentence to start
- A short call to get the details
- A design, with the reasoning behind it
- Free shipping worldwide
- Free pre-analysis if you qualify
- Nothing starts until you agree